
Medical debt is a growing problem in the U.S., with many Americans experiencing financial instability and even bankruptcy. According to a 2016 Kaiser Family Foundation and New York Times survey, more than 1 in 4 Americans had trouble paying a recent medical bill. And when medical debt piles up, that can lead to difficult financial decisions, such as needing to cut back on food, clothing, or other basic household items
Although unexpected events like hospital stays are a big contributor (The American Journal of Medicine reports that nearly half of people who experienced medical bankruptcy named hospital bills as their biggest expense), but the high cost of medical care certainly doesn’t help. To take just one example, the average hospital stay in the U.S. costs $5,220 per day—compared to just $765 in Australia. Overall, the U.S. spends $3.5 trillion on health care per year.
The following statistics help illuminate the scope of the medical debt problem in the U.S.
The reality of medical debt
Medical debt problems can strike anyone: The problem cuts across age groups and educational levels. Even people who would be considered financially responsible can be affected by medical debt. More than half of Americans with medical debt have no other debts listed on their credit reports. Medical debt alone could make it harder for these individuals to buy houses or get a decent rate on a credit card.
- The average age of people who go through a medical bankruptcy is 44.9 years. (American Journal of Medicine, 2009)
- Among people who experience a medical bankruptcy, 46.3% are married. (American Journal of Medicine, 2009)
- Among people who experience a medical bankruptcy, 60.3% attended college. (American Journal of Medicine, 2009)
- The average monthly household income of medical bankruptcy filers is $2,586/month. (American Journal of Medicine, 2009)
- Among families who experience medical bankruptcy, 20.1% are military families. (American Journal of Medicine, 2009)
- The average debt for households that experience medical bankruptcy is $44,622. (American Journal of Medicine, 2009)
- About 19.5% of consumer credit reports include one or more medical collections. (Consumer Financial Protection Bureau, 2014)
- The average unpaid medical debt recorded on credit reports is $579. (Consumer Financial Protection Bureau, 2014)
- 22% of consumers with debts in collection have only medical debts. (Consumer Financial Protection Bureau, 2014)
- 54% of consumers with medical debt have no other debts listed on their credit reports. (Consumer Financial Protection Bureau, 2014)
The human cost of medical debt
Medical debt—and the fear of medical debt—has severe consequences for Americans. One of the largest issues is that debt can cause people to neglect medical problems. Nearly 1 in 3 Americans say that they have delayed getting care because they were worried about the cost.
In any other field, when people worry about paying too much for a service, they could shop around. But Americans who tried this with medical services don’t always have much luck. Among adults who say they tried to shop around, 69% called the experience somewhat difficult or very difficult.
- 21% of adults ages 18-64 have not undergone a medical test or treatment that was recommended by a doctor because of the cost. (Kaiser Family Foundation / New York Times, 2016)
- 32% of adults ages 18-64 have postponed getting medical care they need because of the cost. (Kaiser Family Foundation / New York Times, 2016)
- 40% of adults ages 18-64 have relied on home remedies or over-the-counter drugs instead of going to a doctor, because of the cost. (Kaiser Family Foundation / New York Times, 2016)
- 34% of adults ages 18-64 say their doctor never explains the costs of procedures to them. (Kaiser Family Foundation / New York Times, 2016)
- Among adults who say they tried to shop around at different providers to find the best price for medical services, 69% called the experience somewhat difficult or very difficult. (Kaiser Family Foundation / New York Times, 2016)
- Among those with medical bill problems, 44% say those problems had a major impact on their family. (Kaiser Family Foundation / New York Times, 2016)
- Among those with medical bill problems, 29% say problems with medical debt started causing problems with paying other, non-medical bills. (Kaiser Family Foundation / New York Times, 2016)
- 62% of those with medical bill problems say they had health insurance when treatment began. (Kaiser Family Foundation / New York Times, 2016)
- Among those with medical bill problems who had insurance, 26% say the reason they had trouble paying is their claim was denied. (Kaiser Family Foundation / New York Times, 2016)
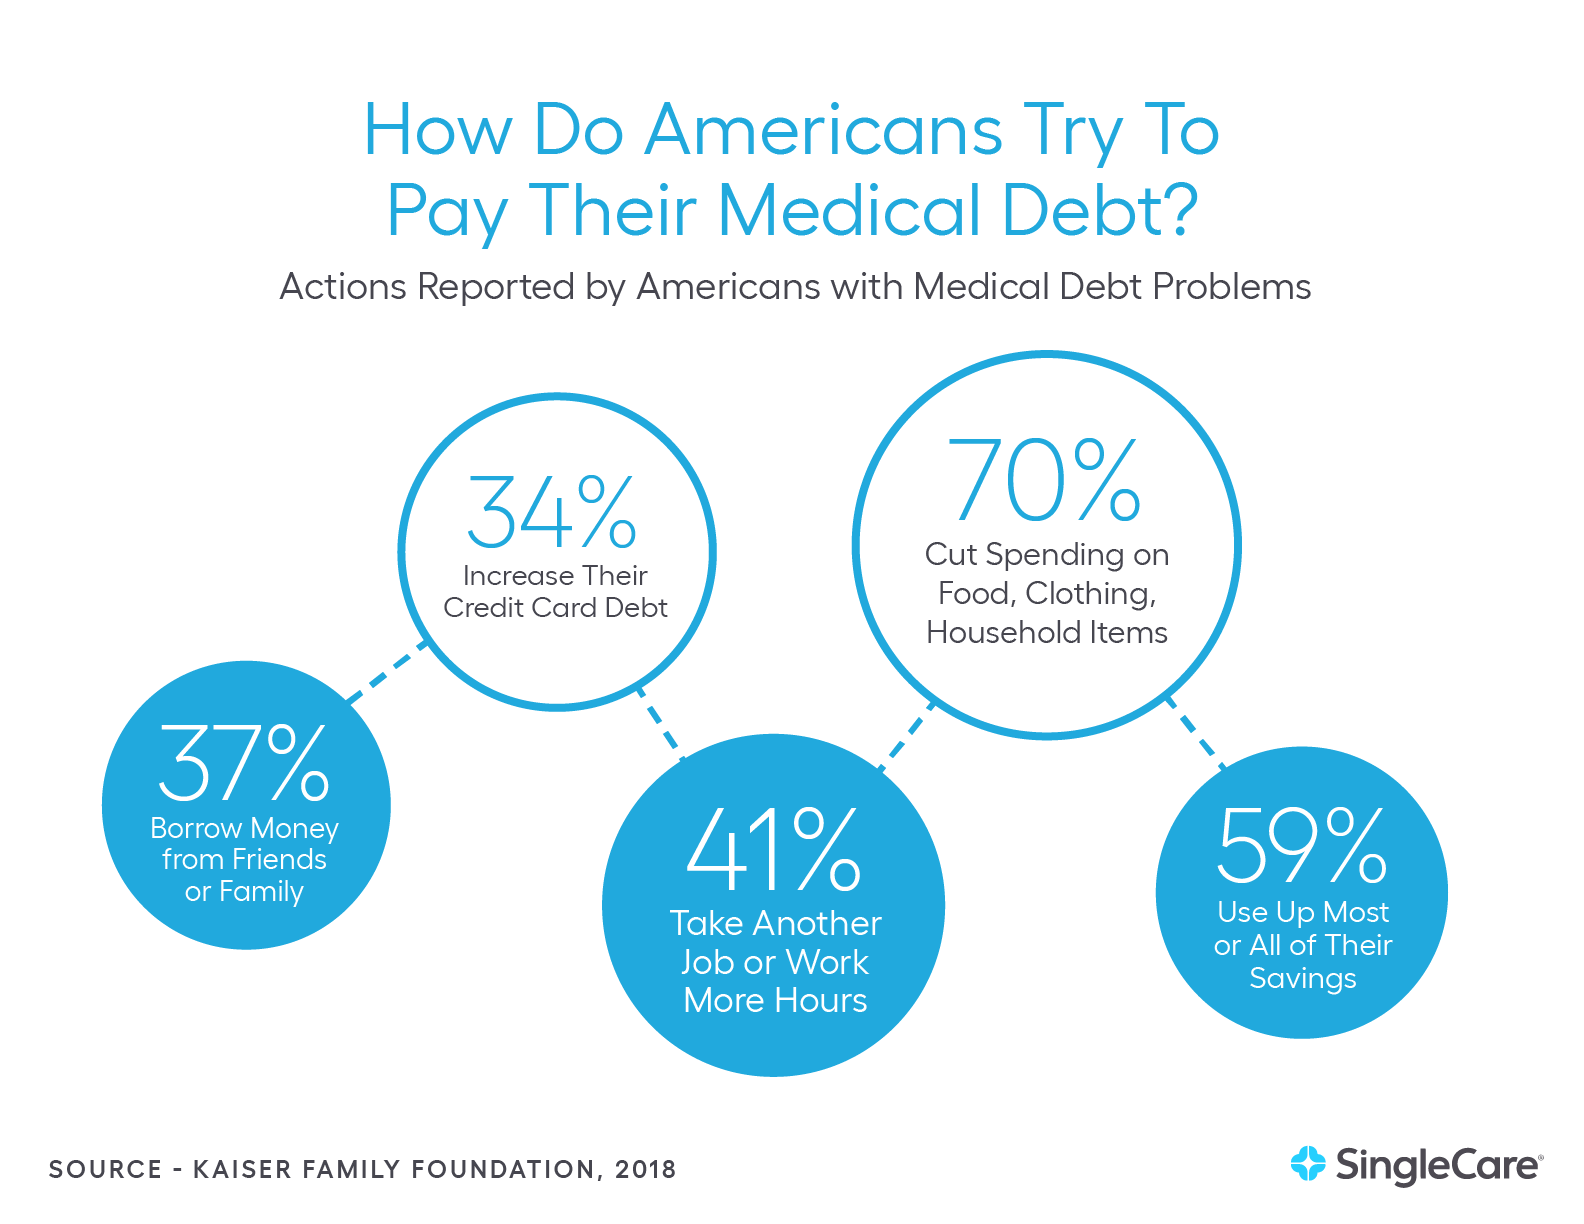
Ultimately, medical bills can leave some individuals with limited options for avoiding bankruptcy. Among Americans with medical bill problems:
- 53% say they worked out a payment plan with their provider.
- 37% say they borrowed money from friends or family.
- 34% say they increased their credit card debt.
- 70% say they cut back spending on food, clothing, or other basic household items.
- 41% say they took an extra job or worked more hours.
- 59% say they used up most or all of their savings.
- 35% say they have been unable to pay for basic necessities like food, heat, or housing.
Source: Kaiser Family Foundation / New York Times, 2016
Numerous health industry startups, like SingleCare, are working to find innovative solutions to lower medical costs. Americans who take advantage of these new options may be able to keep medical debt from getting out of control.
Medical debt can create ongoing financial issues as well. Among Americans with medical bills in collection:
- 15% say they owe $10,000 or more.
- 33% say they also have a student loan.
- 17% say they also owe money to a payday lender.
- 58% say they have been contacted by a collection agency.
Source: Kaiser Family Foundation / New York Times, 2016
RELATED: How to get help with medical bills without insurance
What causes medical debt?
Not every medical expense turns into debt. And the bills themselves aren’t always the sole problem. People who get sick or have to care for a sick loved one may see their income drop because of time off work. In fact, more than 1 in 7 medical bankruptcies is due to a child’s illness.
Through surveys, researchers have identified people dealing with medical debt. These Americans’ responses reveal the financial and medical situations that are most likely to lead to severe financial stress.
- 62.1% of those who filed for bankruptcy named medical bills or loss of income due to sickness or caretaking as the reason for their bankruptcy. (American Journal of Medicine, 2009)
- 14.6% of medical bankruptcies were due to an illness of a child. (American Journal of Medicine, 2009)
- Among those with medical bill problems, 10% say they had bills as low as $500 or less. (Kaiser Family Foundation / New York Times, 2016)
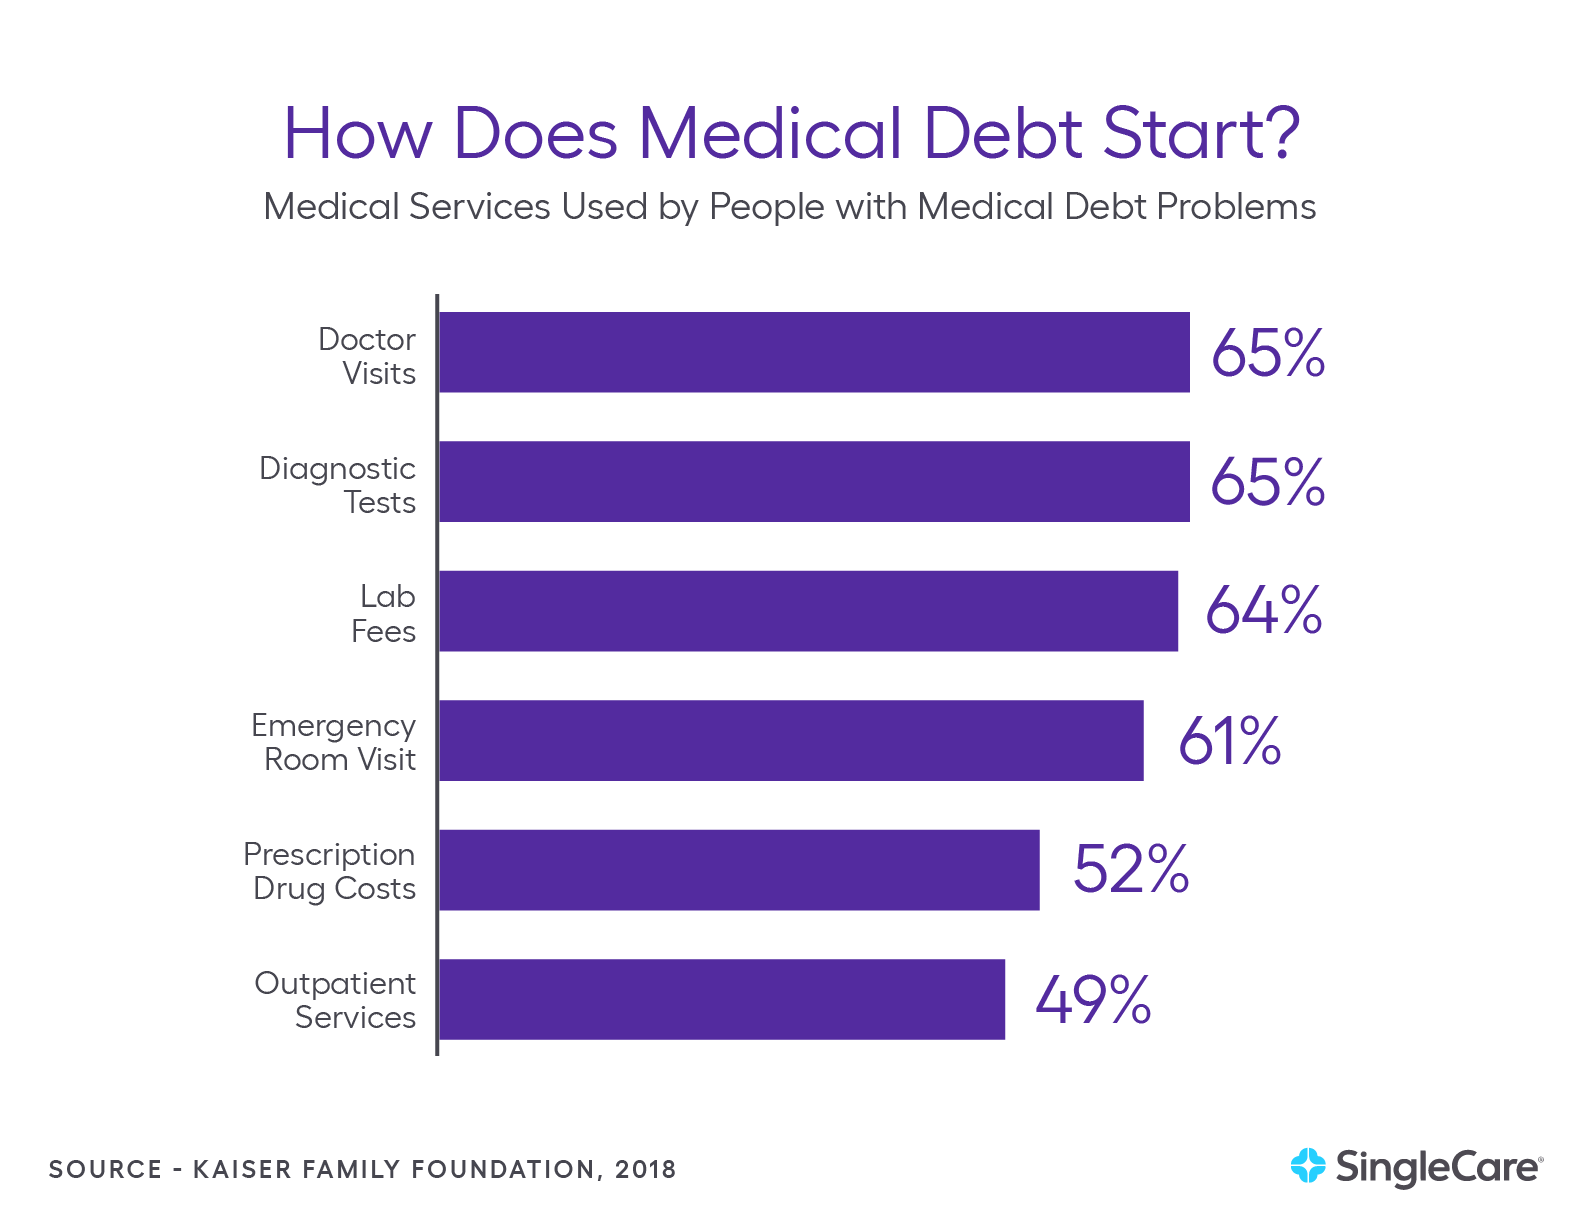
One recent survey identified the specific medical services that led to medical debt. Among the reported services that led to problems with medical bills the findings were:
- Doctor Visits: 65%
- Diagnostic Tests: 65%
- Emergency Room Visits: 61%
- Outpatient Services: 49%
- Lab Fees: 64%
- Prescription Drug Costs: 52%
- Nursing Home Care or Long-Term Care: 4%
- Dental Care: 41%
- Child Medical Care: 25%
- Short-Term Single Hospital Stay: 66%
Source: Kaiser Family Foundation / New York Times, 2016
Another study asked similar questions about the causes of medical debt.
- 48% of people who experienced medical bankruptcy named hospital bills as their biggest expense. (American Journal of Medicine, 2009)
- 18.6% of people who experienced medical bankruptcy named prescription drugs as their biggest expense. (American Journal of Medicine, 2009)
- 15.1% of people who experienced medical bankruptcy named doctor bills as their biggest expense. (American Journal of Medicine, 2009)
- 4.1% of people who experienced medical bankruptcy named premiums as their biggest expense. (American Journal of Medicine, 2009)
- Out-of-pocket medical costs averaged $17,943 for medically bankrupt families. (American Journal of Medicine, 2009)
Medical cost statistics
The problem of medical debt is closely linked to medical costs. The U.S. spends more than similar countries on health care, and the burden of this cost cuts across the American economy, requiring massive payments from the public sector, private sector, and individuals.
Bearing this cost means governments have less to spend on education and infrastructure improvements. It means that businesses have less to spend on research and development. It means that American households have less to spend on clothing and food.
And the burden is growing. The U.S. now spends more than $10,000 per person on health care per year, up from less than $5,000 per person per year in 2009.
- The U.S. spends $3.5 trillion on health care per year. (National Health Expenditure Data, 2017)
- The U.S. spends $10,739 per person on health care per year. (National Health Expenditure Data, 2017)
- Healthcare spending accounts for 17.9% of the U.S. Gross Domestic Product (GDP). (National Health Expenditure Data, 2017)
- Americans spend $1.18 trillion per year on private health insurance. (National Health Expenditure Data, 2017)
- Americans spend $365.5 billion per year on out-of-pocket medical expenses. (National Health Expenditure Data, 2017)
- Americans spend $1.14 trillion per year on hospital expenditures. (National Health Expenditure Data, 2017)
- Spending on private health insurance accounts for 34% of total U.S. healthcare spending. (National Health Expenditure Data, 2017)
- Spending on out-of-pocket expenses accounts for 10% of total U.S. healthcare spending. (National Health Expenditure Data, 2017)
- Americans spend $694.3 billion per year on physician and clinical services. (National Health Expenditure Data, 2017)
- Americans spend $333.4 billion per year on prescription drugs. (National Health Expenditure Data, 2017)
- Households account for 28% of total healthcare spending. (National Health Expenditure Data, 2017)
- Private businesses account for 19.9% of healthcare spending. (National Health Expenditure Data, 2017)
- On average, spending on health care for an American ages 65 and older is $19,098 per year. (National Health Expenditure Data, 2014)
- On average, spending on health care for a working-age American (18-64) is $7,153 per year. (National Health Expenditure Data, 2014)
- On average, spending on health care for an American child (0-18) is $3,749 per year. (National Health Expenditure Data, 2014)
- On average, U.S. spending on health care for females is $8,811 per year. (National Health Expenditure Data, 2014)
- On average, U.S. spending on health care for males is $7,272 per year. (National Health Expenditure Data, 2014)
- Medicare spending accounts for 17.1% of the U.S. federal budget. (California Health Care Foundation, 2019)
- Medicaid spending accounts for 9.5% of the U.S. federal budget. (California Health Care Foundation, 2019)
The cost of health insurance
Most people rely on health insurance to subsidize their medical costs, but the cost of coverage keeps rising.
- The average deductible is $4,544. This means insured patients are expected to pay nearly $5,000 out of pocket before insurance will cover any medical expenses or prescription drugs. (Kaiser Family Foundation, 2019)
- The average premium increased 4% for individuals and 5% for families in 2019. For context, worker’s wages only increased 3.4% and inflation increased 2%. (Kaiser Family Foundation, 2019)
RELATED: Deductible vs. premium
How are medical care costs being spent?
A recent study identified what medical services account for the most U.S. medical spending. In the U.S., here is the annual spending for treating the following conditions:
- Routine Care, Signs, and Symptoms: $289.9 billion
- Circulatory System Diseases: $259.2 billion
- Musculoskeletal System Diseases: $219.8 billion
- Respiratory System Diseases: $176.5 billion
- Endocrine System Diseases: $168.7 billion
- Nervous System Diseases: $159.5 billion
- Mental Illness: $109.6 billion
- Pregnancy-Related Treatments: $50.5 billion
Source: California Health Care Foundation, 2019
- 33% of U.S. health spending goes toward hospital care. (California Health Care Foundation, 2019)
- 20% of U.S. health spending goes toward physician and clinical services. (California Health Care Foundation, 2019)
- 10% of U.S. health spending goes toward prescription drugs. (California Health Care Foundation, 2019)
RELATED: How to save on prescriptions
Who is paying U.S. medical costs?
The burden of the high costs of U.S. medicine is borne nearly equally by governments, individuals, and businesses. According to the California Health Care Foundation (2019):
- The federal government pays 28% of total U.S. health expenditures. (California Health Care Foundation, 2019)
- Individuals and households pay 28% of total U.S. health expenditures. (California Health Care Foundation, 2019)
- Private businesses pay 20% of total U.S. health expenditures. (California Health Care Foundation, 2019)
- State and local governments pay 17% of total U.S. health expenditures. (California Health Care Foundation, 2019)
- Other private organizations, such as nonprofits, pay 7% of total U.S. health expenditures. (California Health Care Foundation, 2019)
- On average, 37% of a household’s total health spending goes toward out-of-pocket expenses. (California Health Care Foundation, 2019)
- On average, 28% of a household’s total health spending goes toward their share of employer-sponsored health insurance. (California Health Care Foundation, 2019)
- On average, 17% of a household’s total health spending goes toward supporting Medicare via the payroll tax. (California Health Care Foundation, 2019)
- Total spending on private health insurance in the U.S. is $1.2 trillion. (California Health Care Foundation, 2019)
- 45% of the total amount spent on private health insurance is covered by private businesses. (California Health Care Foundation, 2019)
- 23% of the total amount spent on private health insurance is covered by the government (mostly, as contributions to employer-sponsored health plans). (California Health Care Foundation, 2019)
- Total U.S. out-of-pocket spending per Capita has risen from $91 in 1967 to $1,124 in 2017. (California Health Care Foundation, 2019)
A recent study showed how spending is spread among Americans of different ages:
- Americans ages 85 and older: Account for 2% of the population, and 8% of healthcare spending. Average annual spending for a person in this age group is $32,411.
- Americans ages 65-84: Account for 12% of the population, and 26% of the healthcare spending. Average annual spending for a person in this age group is $16,872.
- Americans ages 45-64: Account for 26% of the population, and 33% of the healthcare spending. Average annual spending for a person in this age group is $9,513.
- Americans ages 19-44: Account for 35% of the population, and 21% of the healthcare spending. Average annual spending for a person in this age group is $4,458.
- Americans age 18 and younger: Account for 25% of the population, and 12% of the healthcare spending. Average annual spending for a person in this age group is $3,352.
Source: California Health Care Foundation, 2019
How U.S. health care costs compare with other countries
Americans may be suffering from higher levels of medical debt because, in part, of the high cost of care in the U.S.. People in countries with lower healthcare costs aren’t as susceptible to medical debt and bankruptcy.
But this isn’t because everything is less expensive in countries with lower medical costs. Researchers have identified countries with similar levels of wealth to the United States and found that U.S. healthcare costs are much higher than any discrepancy in wealth.
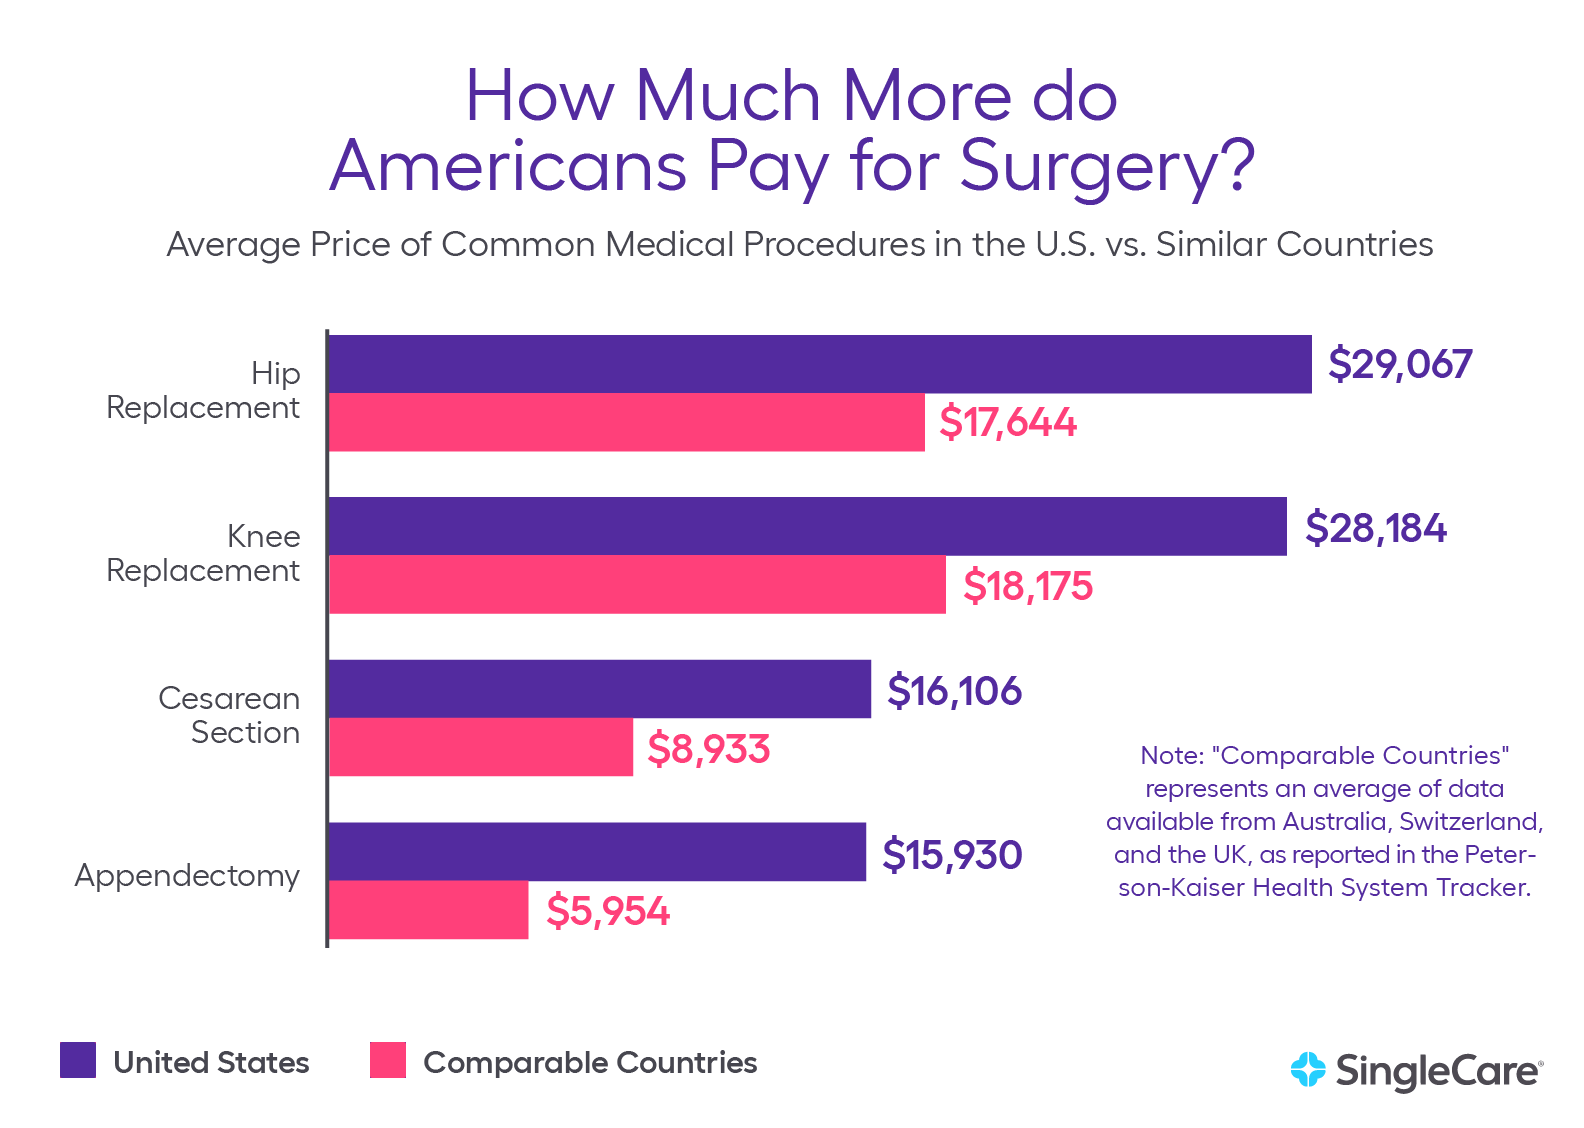
For example, total health spending per capita is 84.8% higher in the U.S. than it is in Canada. The following statistics show how much more Americans pay for common medical procedures than individuals in other countries.
- The average hospital stay cost per day in the U.S. is $5,220. The average hospital stay cost per day in Australia is $765. (Kaiser Family Foundation, 2018)
- The average cost for heart bypass surgery in the U.S. is $78,318. The average cost for heart bypass surgery in the U.K. is $24,059. (Kaiser Family Foundation, 2018)
- U.S doctors perform 322 cesarean sections per 1,000 live births. The average among similarly wealthy countries is 264 C-sections per 1,000 live births. (Kaiser Family Foundation, 2018)
- The average price of a normal birth delivery in the U.S. is $10,808. The average price of a normal birth delivery in Australia is $5,312. (Kaiser Family Foundation, 2018)
- The average price of a cesarean section in the U.S. is $16,106. The average price of a C-section in Australia is $7,901. (Kaiser Family Foundation, 2018)
- The average price of an MRI in the U.S. is $1,119. The average price of an MRI in Australia is $215. (Kaiser Family Foundation, 2018)
- The average price of an appendectomy in the U.S. is $15,930. The average price of an appendectomy in the United Kingdom is $8,009. (Kaiser Family Foundation, 2018)
- The average price of a hip replacement in the U.S. is $29,067. The average price of a hip replacement in the United Kingdom is $16,335. (Kaiser Family Foundation, 2018)
- The average price of Humira, a drug used for the treatment of arthritis, is about 96% higher in the United States than in the United Kingdom. (Kaiser Family Foundation, 2018)
- The average cost of a CT scan in the U.S. ($896) is eight times higher than in Canada ($97). (Kaiser Family Foundation, 2018)
A 2011 Health Affairs study compared health spending among countries and found that U.S. health spending per capita is significantly higher than that of similar countries.
U.S. health spending per capita is:
- 141% higher than in the United Kingdom.
- 125% higher than in Australia.
- 104% than in France.
- 102% higher than in Germany.
Source: Health Affairs, 2011
Other findings from the study include:
- 30.8% of U.S. per capita health spending is on ambulatory care. The average annual income for a U.S. primary care physician is $186,582. (Health Affairs, 2011)
- On average, a U.S. primary care physician earns $61,478 more a year than a primary care physician in Canada. (Health Affairs, 2011)
- The average annual income for a U.S. orthopedic surgeon is $442,450. (Health Affairs, 2011)
- On average, a U.S. orthopedic surgeon earns $233,816 more a year than an orthopedic surgeon in Canada. (Health Affairs, 2011)
Medical costs will continue to grow
High medical costs are caused by systemic issues in the healthcare industry. Until these issues are addressed, medical costs will continue to increase.
- Health spending is projected to reach $6 trillion by 2027. (California Health Care Foundation, 2019)
- Health spending is expected to grow at an average rate of 5.5% per year. (California Health Care Foundation, 2019)
- Health spending is projected to reach 19.4% of GDP by 2027. (California Health Care Foundation, 2019)
- Health spending for people on Medicare was $12,347 in 2017 and is expected to reach $19,546 by 2027. (California Health Care Foundation, 2019)
- Health spending for people on Medicaid was $8,013 in 2017 and is expected to reach $12,029 by 2027. (California Health Care Foundation, 2019)
- Health spending for people on employee-sponsored health care plans was $5,942 in 2017 and is expected to reach $9,137 by 2027. (California Health Care Foundation, 2019)
- Health spending for people on medical plans is expected to rise approximately 50% in the next 10 years. (California Health Care Foundation, 2019)
We encourage journalists, researchers, students, and others to share these statistics. Medical debt, and the high costs that cause it, can destroy finances. According to experts, costs will continue to rise, exposing more and more Americans to the risk of debt. We all have a part to play in demonstrating the seriousness of this issue.
Sources:
- Medical Bankruptcy in the United States, 2007: Results of a National Study, The American Journal of Medicine.
- Kaiser Family Foundation/New York Times Medical Bills Survey, Kaiser Family Foundation
- Cost-Sharing for Plans Offered in the Federal Marketplace, 2014-2020, Kaiser Family Foundation
- 2019 Employer Health Benefits Survey, Kaiser Family Foundation
- Higher Fees Paid To US Physicians Drive Higher Spending For Physician Services Compared To Other Countries, Health Affairs
- How do healthcare prices and use in the U.S. compare to other countries?, Peterson-Kaiser Health System Tracker
- How does cost affect access to care?, Peterson-Kaiser Health System Tracker
- California Health Care Almanac, California Health Care Foundation
- National Health Expenditure Fact Sheet, National Health Expenditure Data
- National Health Expenditure Historical Data, National Health Expenditure Data
- Consumer credit reports: A study of medical and non-medical collections, Consumer Financial Protection Bureau